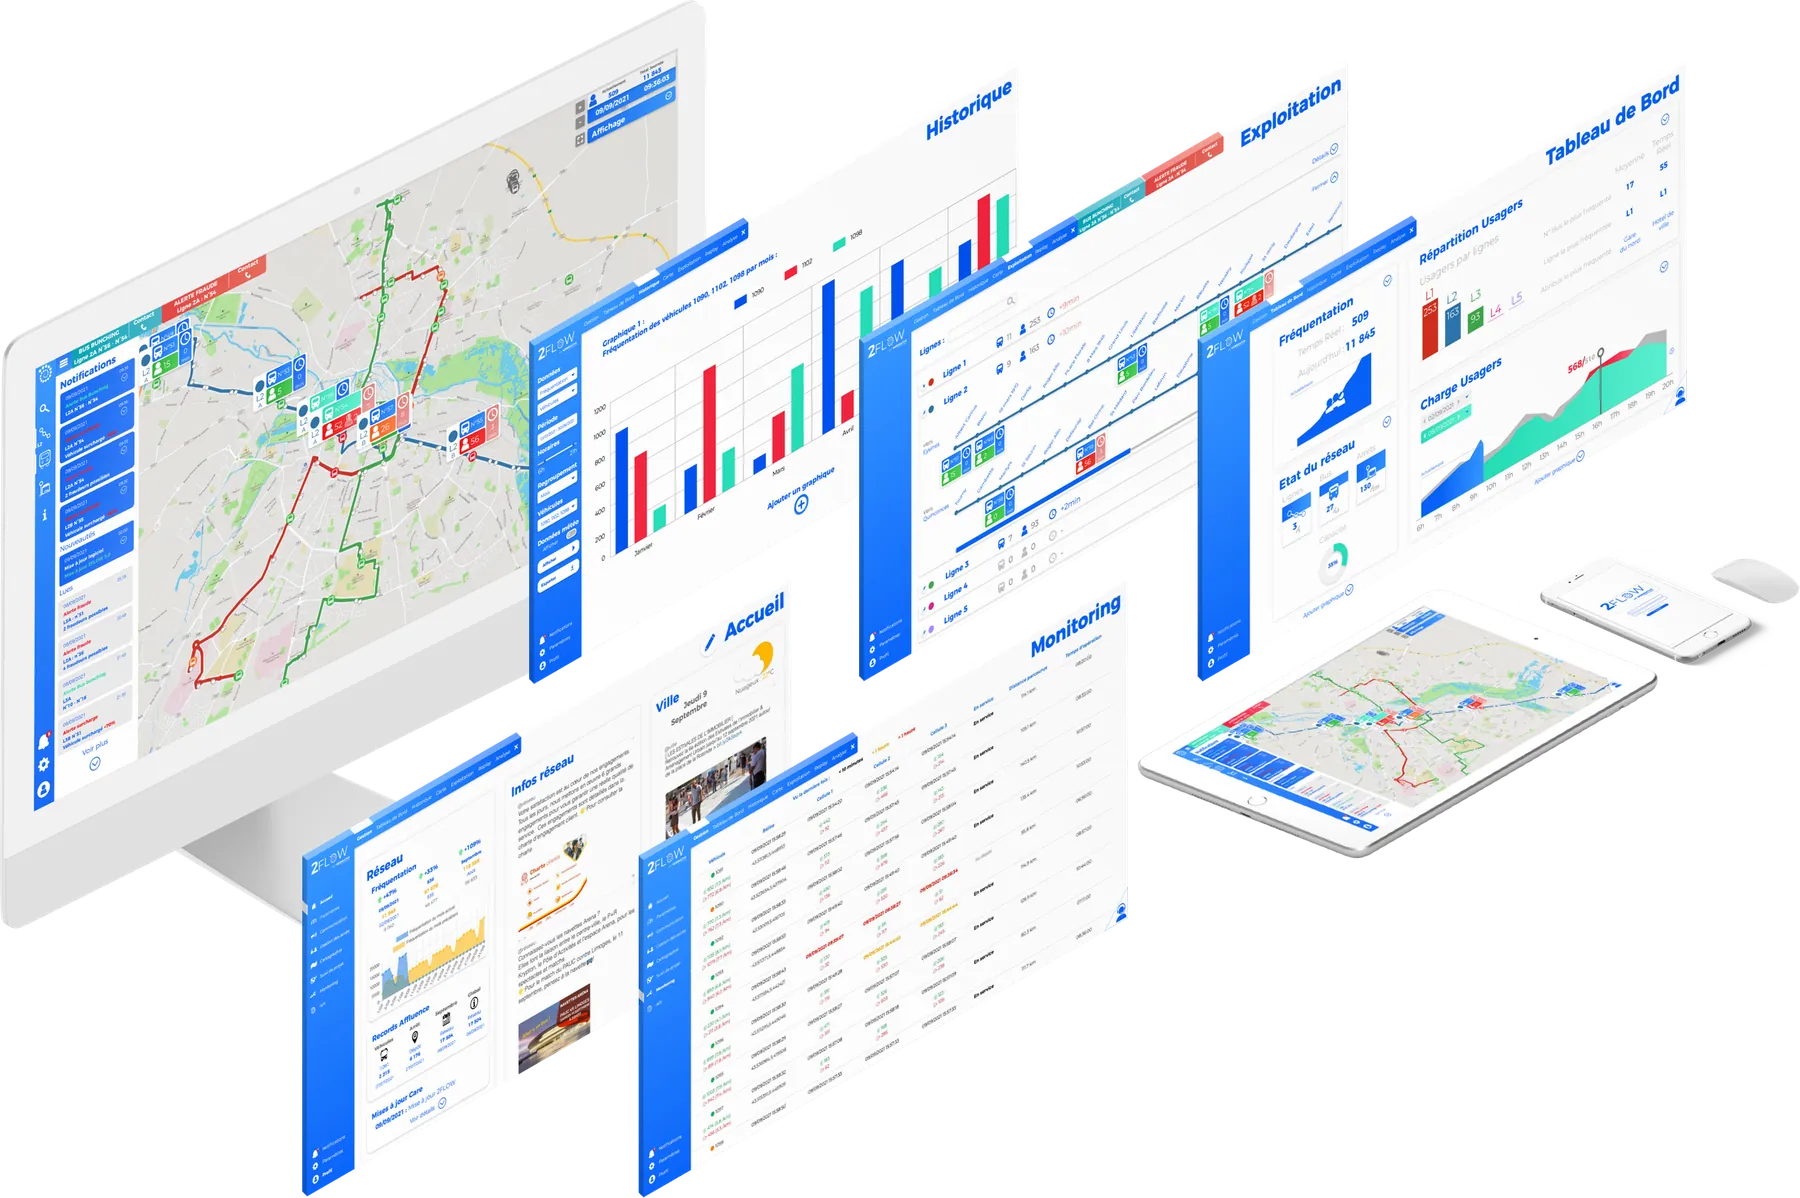
CARE brings your entire network ridership into a single platform: every boarding, every alighting, every vehicle — in real time.
Accessible from any web browser — desktop, tablet and smartphone — it turns counting data into operational decisions.
Passenger flow analytics software · SaaS
The platform that turns your passenger flows into return on investment: data, ridership, occupancy, alerts, origin-destination, fraud.
CARE brings your entire network ridership into a single platform: every boarding, every alighting, every vehicle — in real time.
Accessible from any web browser — desktop, tablet and smartphone — it turns counting data into operational decisions.
CARE offers many features — here are three of them, in action: live status with WE·BOARD, the real-time map with WE·MAP, history and exports with WE·STAT.
WE·BOARD — Network status in real-time charts01 / 03
WE·MAP — Your passenger flows, geolocated on the map02 / 03
WE·STAT — Retrieve, display and export history03 / 03
Enable the modules you need, add the others as your network evolves.
 Home, user accounts and settings management.
 Full passenger-flow history, display and exports.
 Weekly and monthly ridership reports by email.
 Network status in dynamic, real-time charts.
 Network map for geolocated flow visualisation.
 Line-thermometer occupancy view for operations.
 Overcrowding, fraud and bus-bunching alerts… fully configurable.
 Replay all passenger flows up to one week back.
 Classification of on-board passengers: adults, children, wheelchairs, strollers, bikes…
 Fine-grained flow analysis and fraud targeting.
 Per-line origin-destination matrices, powered by EYES 3 AI.
Monitor your equipment in real time, update and configure it without taking a single vehicle out of service.
The 5 tools
 System operation history and reports.
 Remote system configuration: counting zones, modes, sending, IP addressing.
 Remote system updates.
 Instant low-resolution top view from the relevant sensor.
 Retrieval and playback of audit counting sequences.
Automatic detections
The tool in action
Sequence retrieved on demand from the sensor · video audit counting.
Reporting, open data, MaaS, passenger information: 2FLOW data feeds your entire ecosystem.
 All detailed counting data for fine-grained analysis.
 Historical data by vehicle, line, stop and network.
 The same data, in real time, for your operations tools.
 Vehicle occupancy and location for passenger information.
Connected to your mobile app, information displays and your RTPI or MaaS platform, the Passenger Information API broadcasts vehicle positions and occupancy rates in real time.
Every pack includes hosting, data operation and updates.
Pricing on quotation, tailored to your network size. Additional modules can be added to any pack.