HomeTram

Solution · Trams

Passenger counting for trams.

3D counting sensors at the doors of every tram, an on-board rail computer and analytics software: 2FLOW measures ridership by stop and by trip, and tram loads in real time.

Request a demo
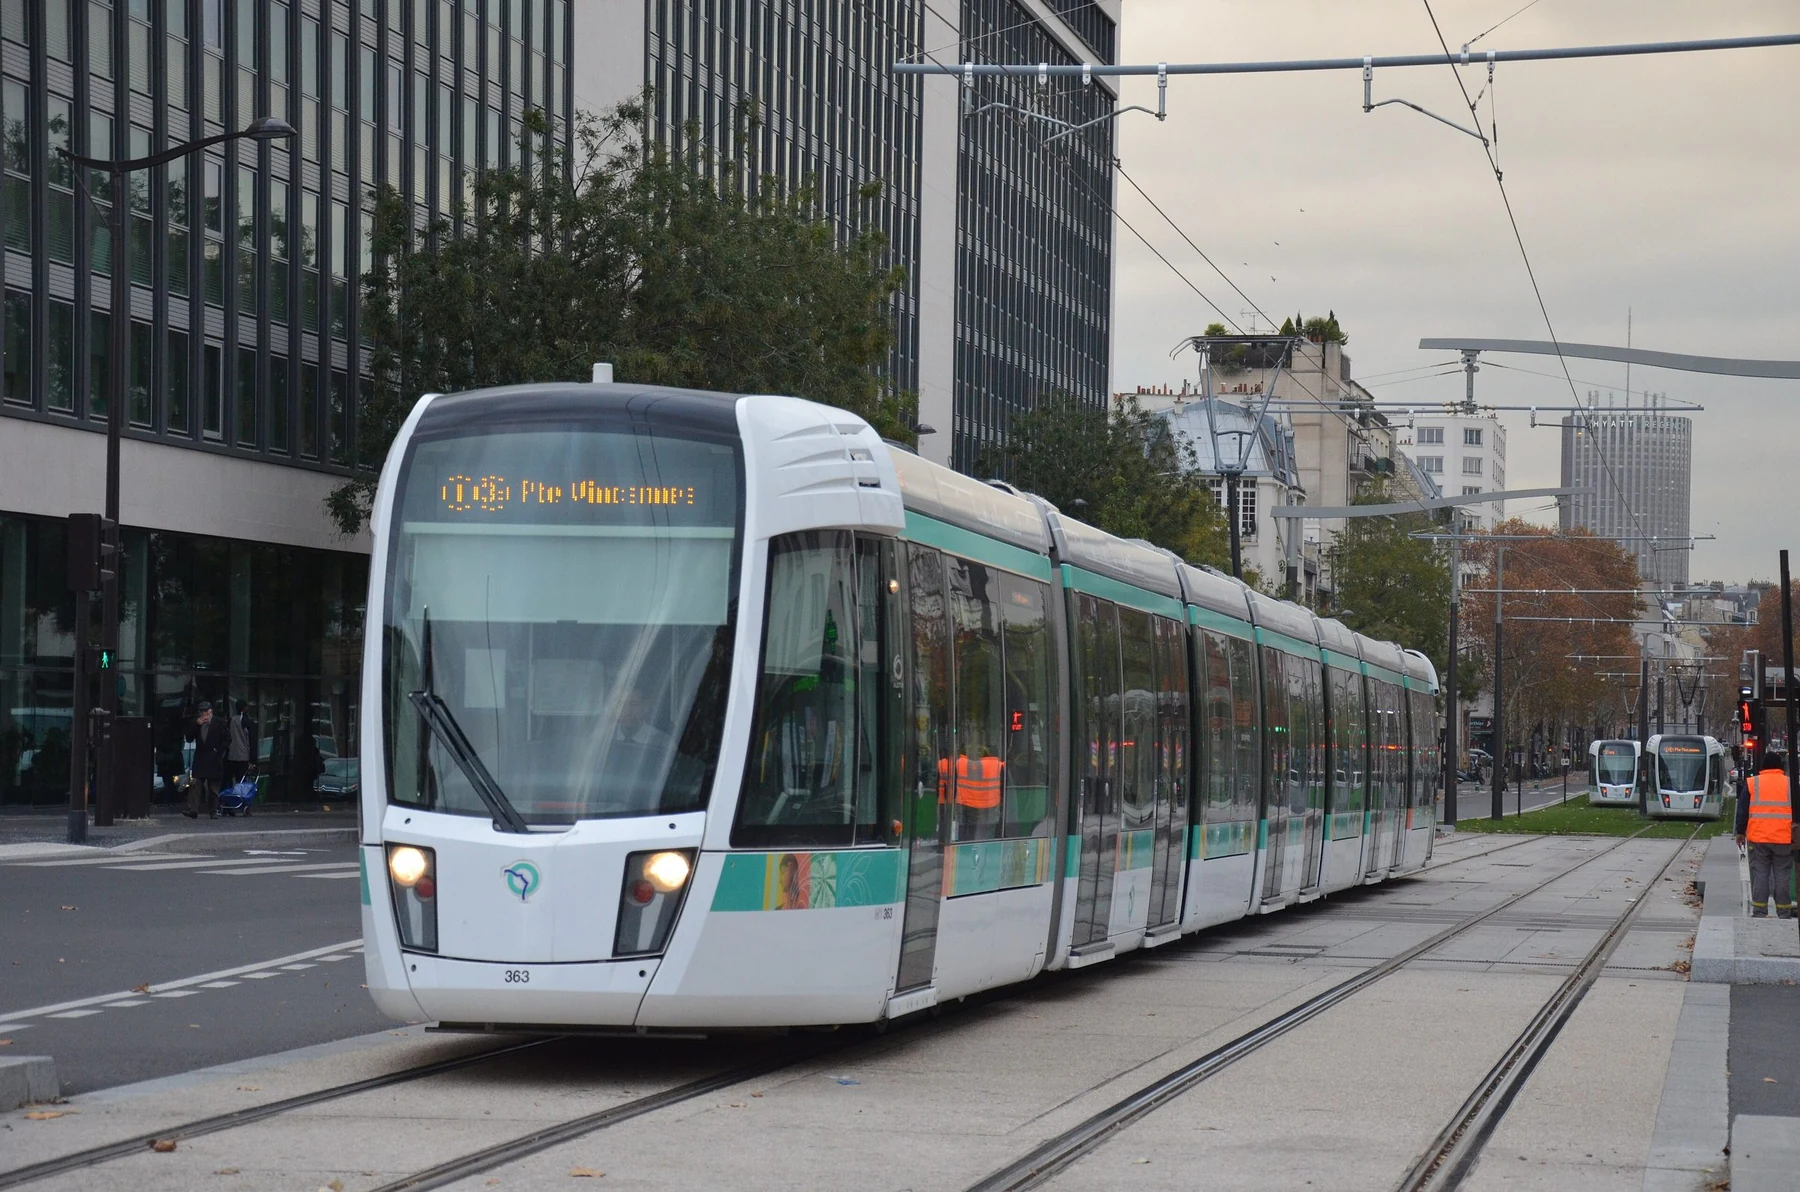
© Florian Fèvre · CC BY-SA 4.0

What you measure

Every tram, every stop, every door.

01

Boardings and alightings

At every door, single or double, by stop, trip and direction.

02

Tram loads

The occupancy rate of each tram in real time, to anticipate overcrowding.

03

Origin-destination

Origin-destination matrices for each line, reconstructed continuously.

04

Passenger information

The occupancy rate of upcoming trams shared with passengers through the API·IV.

The 2FLOW rail chain

An architecture designed for rail.

  1. 1

    EYES 3 AI at the doors

    3D stereo vision and on-board AI, certified accuracy above 98%, EN 50155 certified.

  2. 2

    SPINE in the tram

    The on-board PoE switch connects and powers the sensors: 4 PoE ports, DIN rail, no configuration.

  3. 3

    WEBOX on board

    The rail computer timestamps and geolocates every passage: 8 Ethernet ports incl. 4 PoE, 12–160 V DC, AI video analytics for up to 8 cameras.

  4. 4

    CARE and APIs

    Ridership, load and origin-destination in real time, ITxPT-compatible APIs and export to your data aggregators.

Rail requirements

Proven equipment for rolling stock.

01

Rail standards

EN 50155 for on-board electronics, EN 45545-2 (fire) and EN 61373 (vibration) testing by independent laboratories.

02

On-board integration

Connection to the tram's IP network and door signals, whether factory fit or retrofit.

03

Your analytics tools

The data feeds CARE, your AVL system and data aggregators such as Flowly and CITiO.

In the field

Mulhouse's 22 trams count their passengers.

Mulhouse Alsace Agglomération · Soléa network

All 22 trams on lines 1, 2 and 3 equipped

98.7%of line 1 trips counted in February and March 2025 (98.3% line 2, 98.6% line 3)

Deployed during 2024, the counting sensors report boardings, alightings and tram loads in real time. According to the report, the data has been near-exhaustive since March 2025; it also feeds the Flowly analytics tool.

  • Real-time load monitoring on lines 1, 2 and 3
  • Analyses by day, time slot, stop, trip and direction in Flowly
  • Ridership measured continuously instead of occasional on-board surveys

Figures reproduced as published by the local authority and its operator; the link leads to the original document.

Go further

Prepare your rail project.

Let's look at equipping your trams. An expert will get back to you.

Request a demo